
Hello and welcome back to our Microsoft Fabric series!
In the previous article, we explored Eventhouse — the powerful storage and querying engine (using KQL databases) for real-time, time-series data in Fabric’s Real-Time Intelligence area. We saw how it handles massive volumes of events with lightning-fast queries. If you missed it, go check Eventhouse out for context.
This article, we’re focusing on EventStream — the “front door” for bringing live streaming data into Fabric — and how it powers real-time analytics. This is where the magic of acting on data as it arrives really happens. No coding required for most steps, making it beginner-friendly!
If your organization deals with live data like website clicks, sensor readings, app logs, stock trades, or IoT signals, EventStream + Real-Time Analytics lets you capture, clean, enrich, and analyze it instantly — often turning raw events into alerts or dashboards in seconds.
What is EventStream?
EventStream is a no-code (or low-code) tool in Microsoft Fabric’s Real-Time Intelligence that lets you:
- Capture real-time events from many sources
- Transform (clean, filter, aggregate, join, enrich) the data on the fly
- Route the processed data to one or more destinations
Think of it like a smart pipeline for streaming data: events flow in continuously, get shaped as needed, and go out to where you want them — all without writing complex code.
Key benefits for beginners:
- Visual drag-and-drop editor (like a flowchart)
- Built-in connectors for popular sources
- Immediate preview of data as it flows
- Automatic scaling — handles high volumes easily
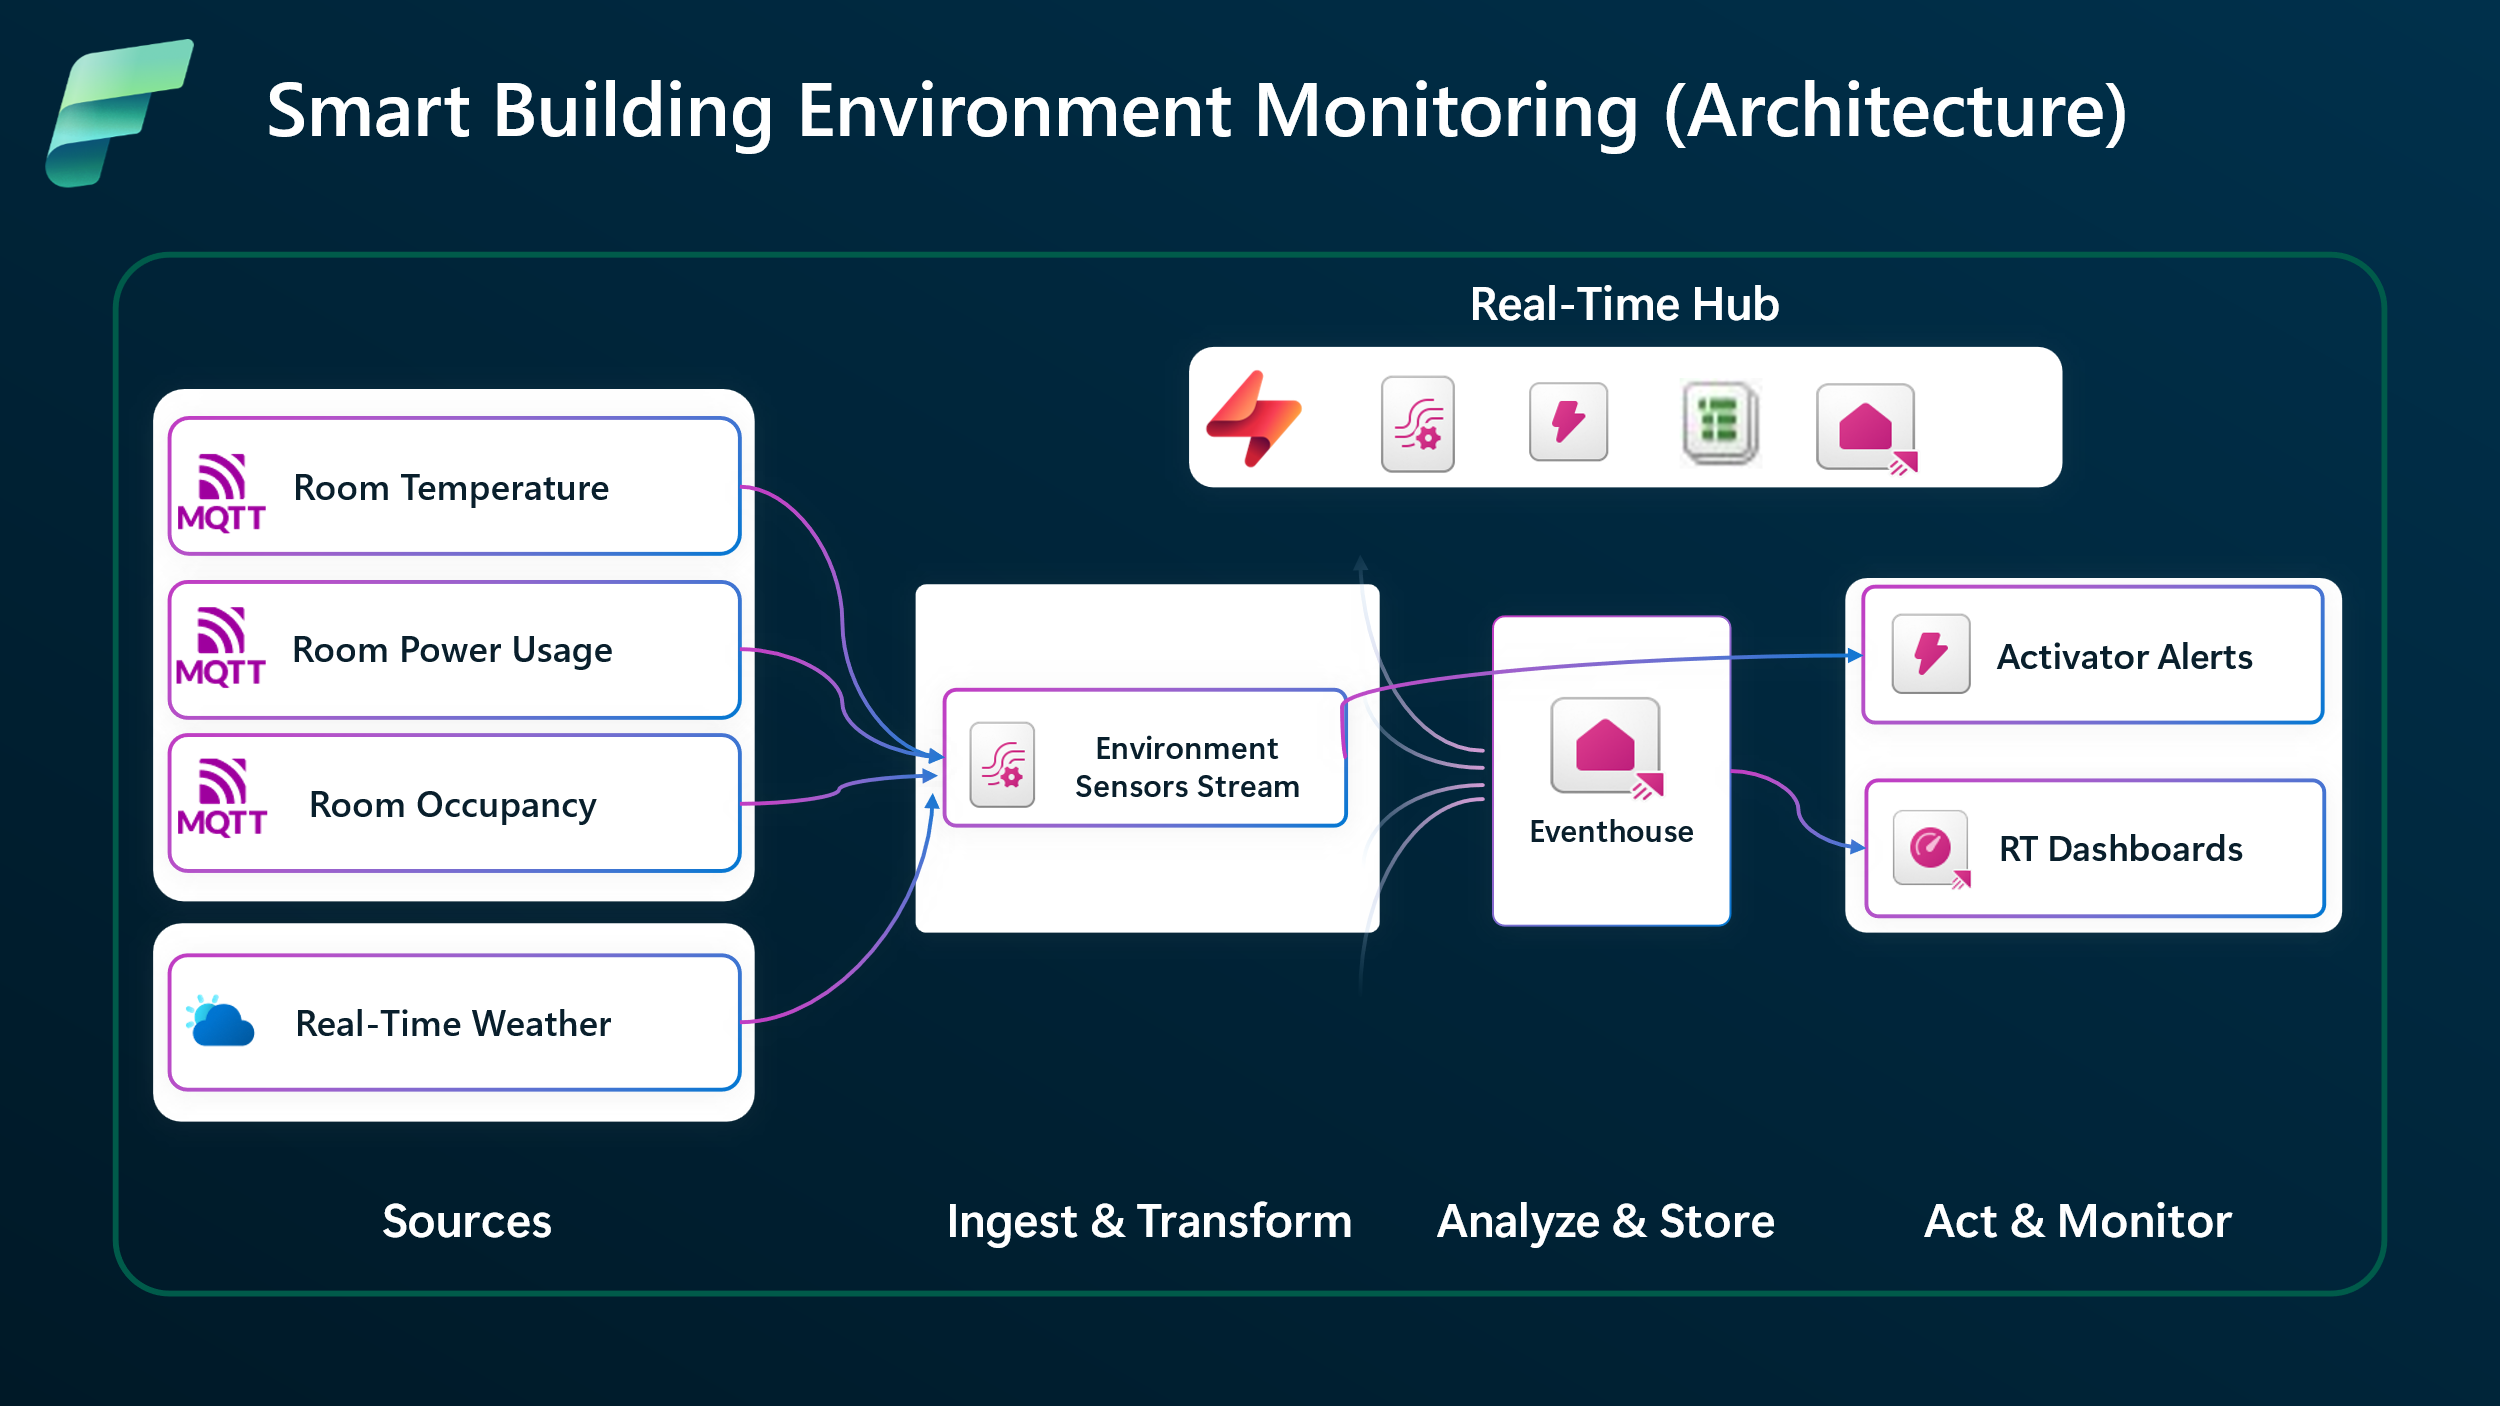
Here’s a high-level architecture diagram showing how EventStream fits into the real-time flow in Fabric:

This diagram illustrates sources feeding into EventStream, processing/storage in Eventhouse, analysis via KQL, and visualization in real-time dashboards or Power BI.
How EventStream Works: The Basic Flow
-
Create an EventStream In your Fabric workspace → New → Eventstream. Give it a name and choose capabilities (standard or enhanced for more sources/transforms).
-
Add Sources (Where data comes from) Common ones include:
- Azure Event Hubs
- Azure IoT Hub
- Apache Kafka / Confluent
- MQTT brokers (great for IoT)
- Custom apps pushing data
- Sample data for testing
You can add multiple sources to one EventStream.
-
Transform the Data (Optional but powerful) Use the visual editor to:
- Filter rows
- Aggregate (sum, count, average over time windows)
- Join with other streams
- Add calculated columns
- Expand JSON
- Manage duplicates
- Use SQL-like operators for advanced logic
Preview results live — see transformed data instantly!
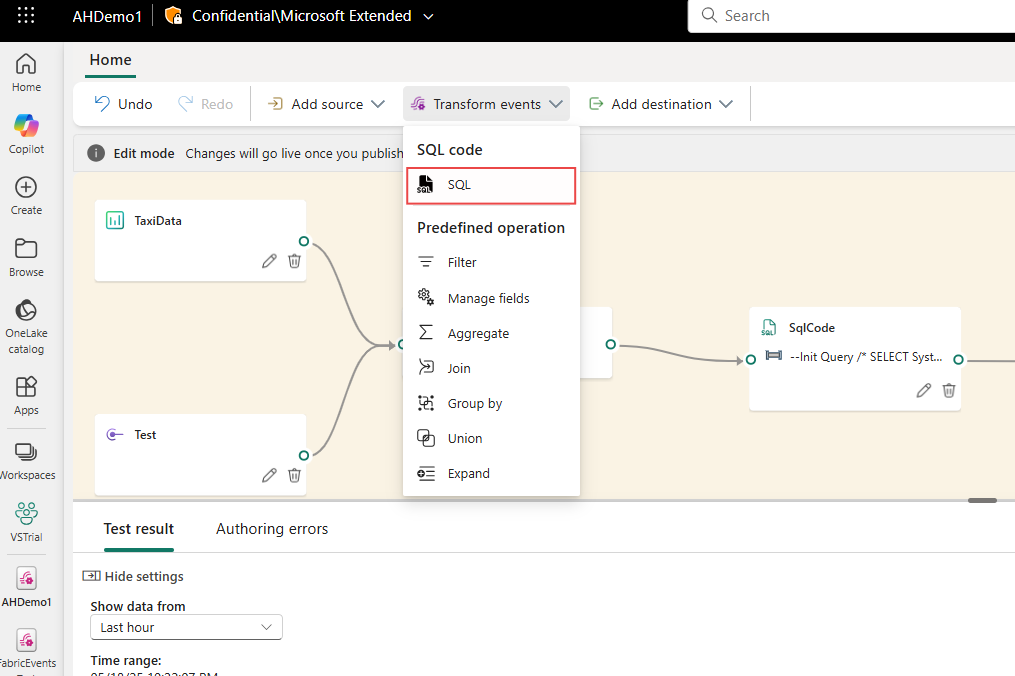
Here’s a screenshot of the EventStream visual editor where you build your pipeline with drag-and-drop nodes:
-
Add Destinations (Where processed data goes) Popular choices:
- Eventhouse (KQL database) — for fast querying and storage
- Lakehouse (Delta tables)
- Custom endpoints
- Other Fabric items
One EventStream can send to multiple places!
This end-to-end flow diagram shows a typical EventStream pipeline with ingestion, processing, and output:
Real-Time Analytics: Turning Streams into Insights
Once data lands in destinations (especially Eventhouse), real-time analytics kicks in:
- Query billions of events in seconds using KQL (Kusto Query Language)
- Build real-time dashboards in Power BI with live refresh
- Create alerts and actions (more on this in future posts)
- Use geospatial analysis for location-based events
- Run ML models or anomaly detection on fresh data
Real-Time Intelligence in Fabric combines EventStream (ingestion + processing) + Eventhouse (storage + query) to give you an end-to-end solution for:
- Monitoring systems live
- Detecting fraud instantly
- Optimizing operations (e.g., smart buildings, supply chain)
- Personalizing user experiences in real time
Here’s an example of a real-time dashboard connected to streaming data from EventStream:

Wrapping Up
EventStream makes streaming data approachable: capture from anywhere, transform easily, route smartly. Paired with Real-Time Analytics (via Eventhouse and KQL), it turns constant data flows into immediate business value — whether monitoring, alerting, or visualizing live.
This builds perfectly on Eventhouse: EventStream brings the data in, Eventhouse stores and queries it fast.
Stay tuned for our next blog post, where we’ll walk you through Data Activator in Fabric — the exciting tool that lets you automatically act on patterns and conditions in your real-time data (e.g., send alerts, trigger workflows, or update systems when something important happens). We’ll keep the series rolling with more hands-on examples!
Thanks for reading! Stay tuned for more practical insights on Microsoft Fabric. Subscribe to the newsletter and keep exploring the world of data. 
#MicrosoftFabric #FabricEventStream #RealTimeAnalytics #EventStream #FabricRealTime #RealTimeIntelligence #StreamingData #PowerBI #DataEngineering #IoT #FabricTutorial #Analytics