
Hello and welcome back to our Microsoft Fabric series!
In the previous article, we explored EventStream and Real-Time Analytics — how to capture live streaming data, transform it with a simple visual editor, store and query it fast in Eventhouse using KQL, and visualize insights in real time with Power BI dashboards. That setup gives you powerful “observe and understand” capabilities for fast-moving data. If you missed it, go check EventStream and RTA out for context.
Today, we complete the real-time loop with Data Activator (also known as Activator or part of Reflex items in Fabric). This is the “act” layer: once your data is flowing and conditions are detected, Data Activator automatically triggers actions — no constant monitoring required!
Imagine your system spotting a problem (like temperature too high or sales dropping sharply) and instantly sending a Teams message, emailing the team, restarting a pipeline, or kicking off a workflow. That’s Data Activator in action — turning passive insights into proactive decisions, often in near real-time.
What is Data Activator?
Data Activator is a no-code automation tool in Microsoft Fabric’s Real-Time Intelligence experience. It continuously monitors your data sources and fires off actions when user-defined rules or conditions are met.
Key points for new learners:
- No coding needed — Use a visual designer to set up what to watch and what to do.
- Fast detection — Works with streaming data for sub-second or low-latency responses.
- Built-in actions — Send emails, post to Teams, trigger Power Automate flows, run Fabric items (like notebooks or pipelines), or call custom endpoints.
- Integrated everywhere — Pulls from EventStream, Eventhouse/KQL, Real-Time Dashboards, Power BI visuals, and more.
Think of it as “IFTTT for your Fabric data” — but enterprise-grade, scalable, and deeply connected to the rest of the platform.
Here’s a high-level diagram showing how Activator connects data sources to actions:
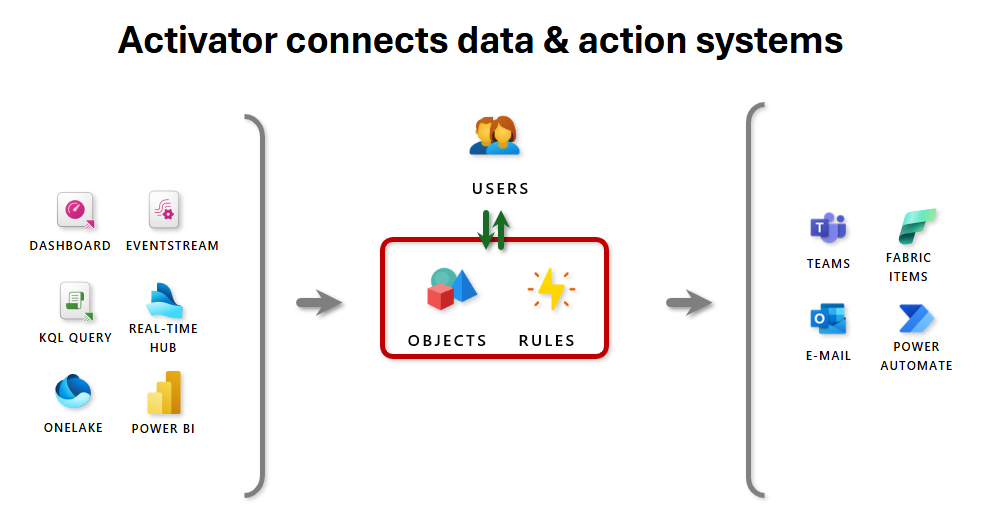
This visual illustrates the flow: data from dashboards, EventStream, KQL queries, etc. → objects & rules in Activator → users get alerts → actions fire in Teams, email, Fabric items, Power Automate, etc.
How Data Activator Works: Step-by-Step Flow
-
Create a Reflex (Activator item) In your Fabric workspace: New → Reflex. This is your container for monitoring rules.
-
Choose & Connect Data Pick a source:
- EventStream (live events)
- Eventhouse / KQL database
- Real-Time Dashboard tiles
- Power BI report visuals
- Fabric system events (e.g., pipeline failures)
Activator auto-detects “objects” (like a package, sensor, or truck) and their “properties” (status, temperature, etc.).
-
Build Rules in the Visual Designer
- Select what to monitor (e.g., “Delivery status” or “Temperature”).
- Define conditions (e.g., “Increases above 25” or “Equals Failed”).
- Add summarization if needed (average over 5 minutes, etc.).
- Choose actions (email, Teams message, Fabric item trigger, etc.).
Here’s a screenshot of the Activator rule creation interface with conditions and actions:

This shows the explorer on the left (objects/properties), live feed/visual in the center, and the rule definition panel on the right where you set conditions and select actions like Teams message.
- Activate & Monitor Save → Start the rule. Activator runs 24/7. View history, triggered alerts, and status right in the Reflex.
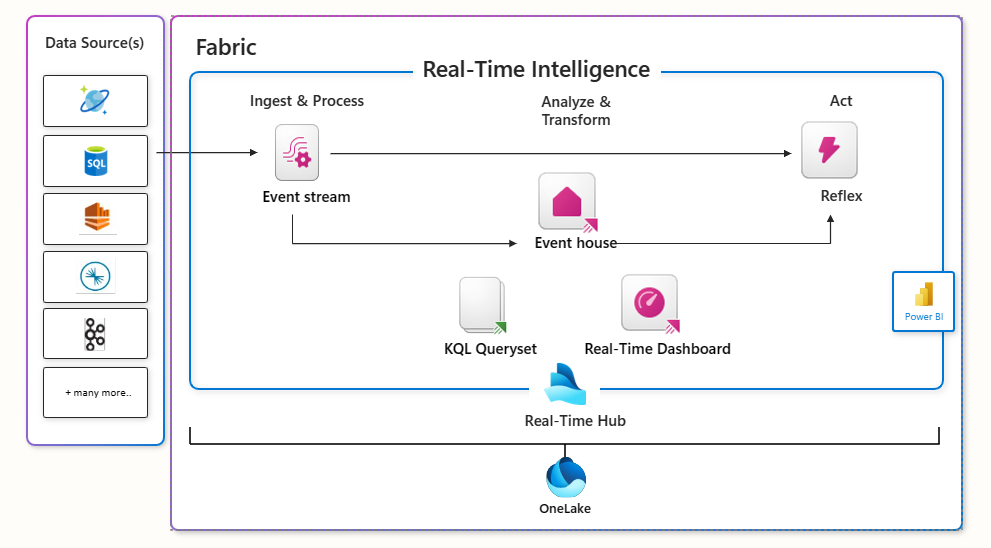
A broader view of how Activator fits into Fabric’s Real-Time Intelligence:
Real-World Examples for Beginners
- IoT Monitoring: If package transit time average > 25 minutes → send Teams alert to logistics.
- Operations: If pipeline run fails 3 times in an hour → email admins and trigger retry flow.
- Business: If sales KPI drops >15% in Power BI report → notify manager via email.
- Anomaly Detection: If error count spikes in streaming logs → post to incident channel.
An example of a triggered Teams notification from Activator:

This shows a welcome/activation message in Teams — real alerts look similar, with custom headlines and details.
Final Thoughts
Data Activator brings the “act” to Fabric’s real-time story: ingest with EventStream → query/analyze in Eventhouse → visualize live → automatically respond when it matters most. It’s empowering for analysts, business users, and engineers to close the loop without custom code or constant watching.
With this article, we’ve now covered the basics of the key components in Microsoft Fabric:
- Lakehouse
- Warehouse
- Lakehouse vs. Warehouse
- Eventhouse
- EventStream & Real-Time Analytics
- Data Activator
This gives you a strong foundation across storage, big data processing, real-time intelligence, and automated actions.
For deeper exploration in specific areas, check out our category-wise articles:
- Data Engineering (pipelines, Spark jobs, medallion layers)
- Power BI (reports, dashboards, real-time visuals, DAX)
- PySpark (notebooks, transformations, ML in Fabric)
- Optimization (performance tuning, capacity management, best practices)
Thanks for following the series — you’re now well-equipped to start building end-to-end solutions in Fabric!
Stay tuned for more advanced guides and real-world scenarios on Microsoft Fabric. Subscribe to the newsletter and keep exploring the world of data. 